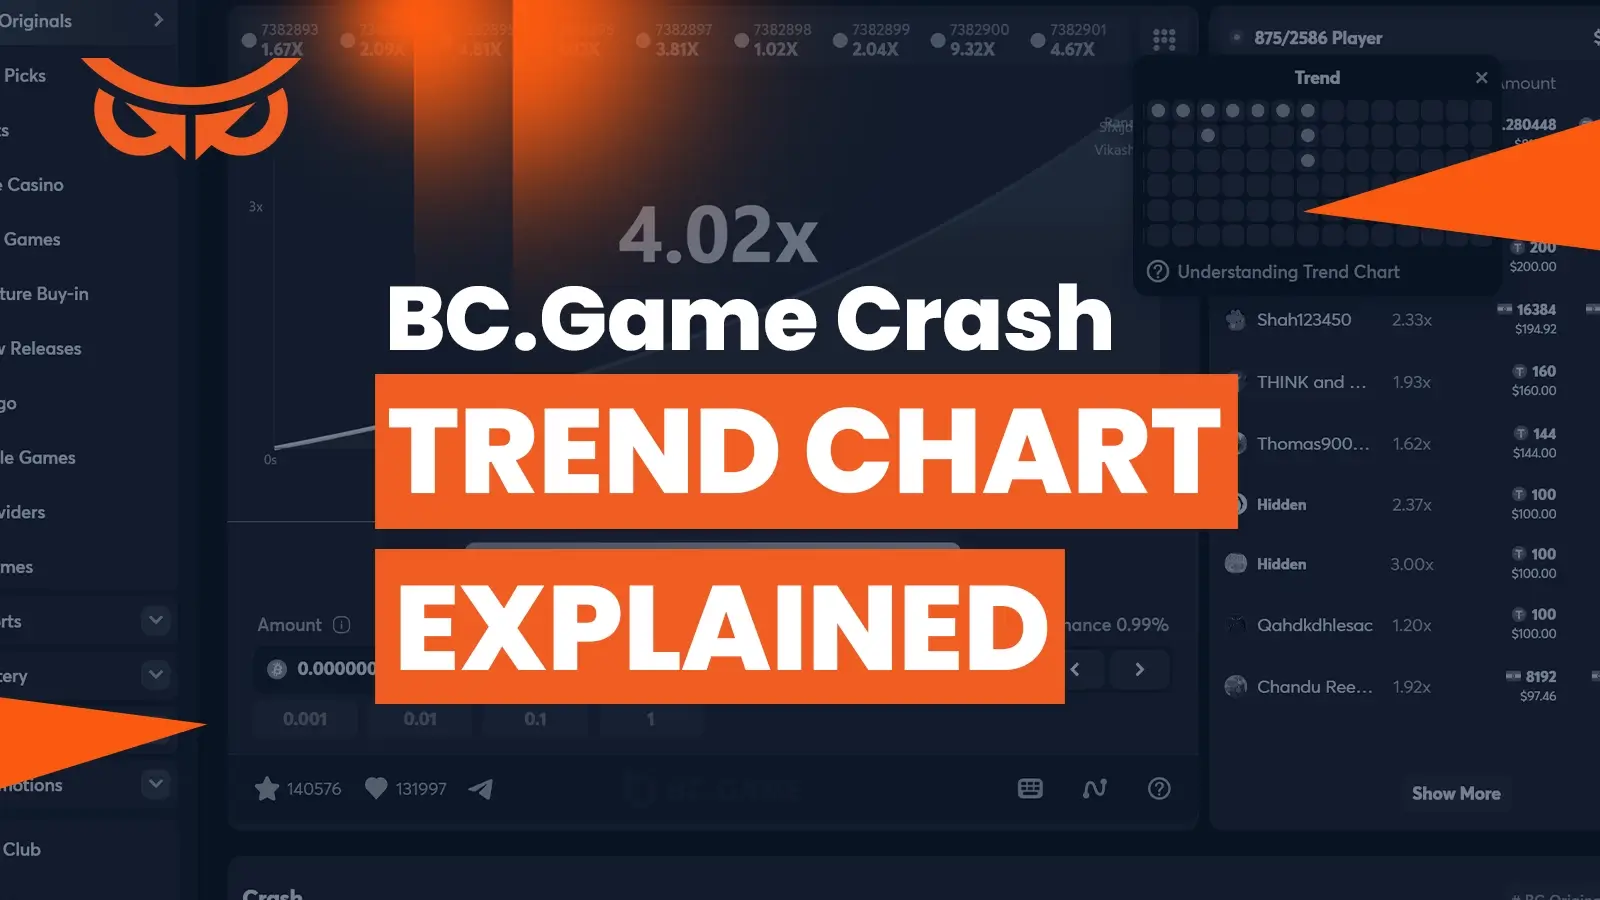
BC.Game Crash is a game that blends simplicity with high-intensity decision-making. One of the tools available to players is the BC.Game trend chart, a feature that allows you to track recent outcomes and analyze patterns.
This guide will explain how to interpret and leverage the BC.Game Crash trend chart, as well as its limitations due to the random nature of the game.
[cta id=4383 type=cta]- 1. Overview of the BC.Game Crash Trend Chart
- 2. Understanding the Trend Chart at BC.Game
- 3. How to Use the BC.Game Trend Chart to Influence Betting Decisions
- 1. Identifying Streaks of Low Multipliers
- 2. Using High Multipliers to Cash Out Early
- 3. Using the Auto-Cash-Out Feature
- 4. Limitations of the BC.Game Trend Chart
- 1. Randomness and Fairness
- 2. Emotional Traps
- 5. Conclusion

Overview of the BC.Game Crash Trend Chart
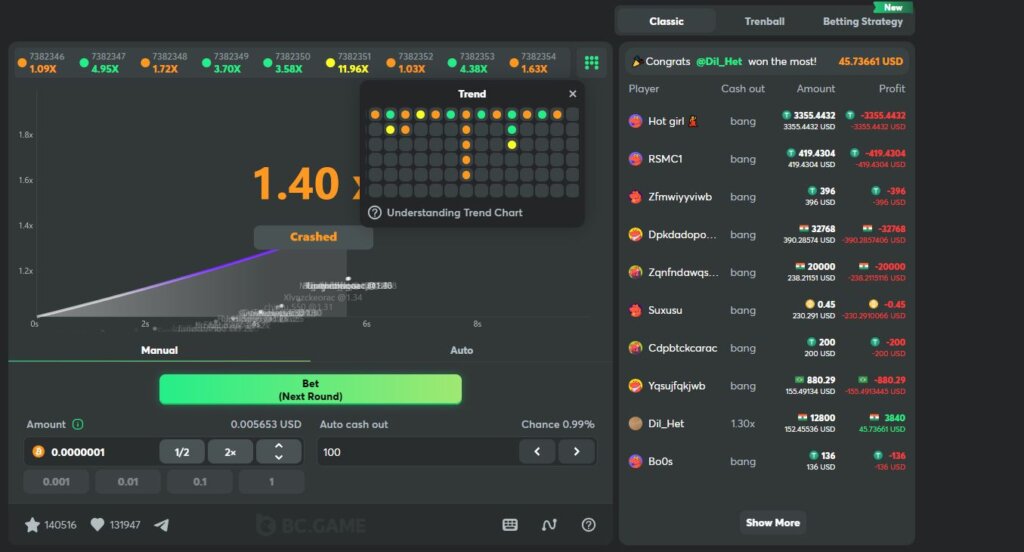
The BC.Game trend chart is a graphical representation of past results in the game, showing how high the multiplier went before the game crashed in previous rounds. Players often use this chart to spot potential patterns or trends in the multipliers, hoping to time their cash-outs more effectively.
It is available just above the action screen, where the most recent results are shown; you can click on the symbol showing multiple dots to uncover a chart that displays the latest results in an easy-to-interpret format.
Understanding the Trend Chart at BC.Game
- Recent Round Multipliers: The trend chart will display how far the multiplier went before the game crashed. For example, you might see the multiplier reach 2.5x in one round, 1.3x in the next, and 10x a few rounds later.
- High vs. Low Multipliers: The chart highlights which rounds ended with low multipliers and which ones went much higher. A common approach is to keep an eye on streaks of low multipliers, as some players may expect a high multiplier round to follow.
- Color-Coding: Many BC.Game trend charts use colors to differentiate between high and low multiplier rounds. This quick visual distinction helps players analyze recent results at a glance.

How to Use the BC.Game Trend Chart to Influence Betting Decisions
If you’re wanting to know how to understand the trend chart in BC.Game, it’s important to remember each result is completely random. Nonetheless, here are a few strategies based on the chart’s information:
1. Identifying Streaks of Low Multipliers
One common method is to look for streaks of low multipliers on the trend chart. If the game has crashed several times at or below 2x in a row, players may anticipate that a higher multiplier is coming soon and adjust their strategy accordingly.
2. Using High Multipliers to Cash Out Early
On the other hand, if the trend chart shows a few rounds with high multipliers, some players may assume that a crash at a low multiplier is more likely in the near future. In this case, they might adjust their bets or cash out earlier to secure smaller, more consistent wins.
3. Using the Auto-Cash-Out Feature
The trend chart can also inform how you use the auto-cash-out feature. If recent multipliers have been hovering around 2x to 5x, you might set your auto-cash-out to a value within that range.
Limitations of the BC.Game Trend Chart
While the BC.Game Crash trend chart can be a helpful tool for analyzing recent outcomes, it’s important to remember the limitations of relying on it.
1. Randomness and Fairness
Each result in BC.Game Crash is determined by RNG, which ensures that every round is fair and independent. The trend chart shows historical data but has no impact on future outcomes.
2. Emotional Traps
It’s easy to fall into the trap of thinking that a big win is “due” after several low-multiplier rounds. However, this is a classic gambler’s fallacy. Just because the trend chart shows a series of low multipliers doesn’t mean a high multiplier is guaranteed.
Conclusion
We hope this page has helped you know how to understand the BC.Game trend tool and how it can be a useful tool for interpreting recent multipliers and informing your betting decisions. However, it’s important to remember that the game’s results are generated randomly, and no chart can predict the future.
If you’re planning to use the BC.Game trend chart today, it is fine as a guide, but always play responsibly and acknowledge the inherent unpredictability of BC.Game Crash.
[cta id=4383 type=cta]


